Aerospace
Application: Aerospace
With the recent occurrence of a door plug blowout on an aircraft in Alaska, we thought it would be interesting to measure cabin pressurization during a flight. To verify that the aircraft cabin pressurization system was working properly, a Precision Barometric Pressure logger was used.
The graph shows a 3 hour flight, from sea level to sea level. Just before takeoff the cabin is slightly pressurized, about 0.1 PSI above ambient, When the aircraft takes off, cabin pressure is gradually reduced to about 10.9 PSI, about the same pressure as at 8000 feet altitude and was held fairly constant until descent. Pressure gradually rises back to 14.8 PSI during descent, and then drops to 14.7 PSI shortly after landing.
Agriculture
Application: Agriculture
What is the temperature underground where your crops grow? We measured the top 30 cm of ground temperatures in mid July day and night so that you could see the interesting characteristics and timing.
The surface temperature was by far the hottest and coldest, and the temperatures farther underground were much more stable. Notice the increasing phase shift with depth: the 30cm-deep waveform is almost 180 degrees (pi radians) out of phase with the surface waveform. The surface reached its highest temperature around 4:00 in the afternoon, while the temperature 30 cm down peaked at 2:30 in the morning, long after the sun had gone down.
HVAC
Application: HVAC
Five data loggers were used to investigate the interactions of a wood stove with the building it is in: 3- Thermocouple, 1- CO2/RH/Temperature/Barometric and 1- Low Pressure logger.
Thermocouple temperatures were recorded in the firebox, the hot air output to the room, and exhaust temperature at the top of the chimney. CO2/RH/Temperature/Barometric pressure was measured around the wood stove. Building pressurization was measured in the same room as the wood stove relative to outdoor pressure. Graphs were visible in realtime as the tests proceeded, with all five loggers shown on the computer screen at all times.
Process
Application: Process
The infrared solder reflow oven was having manufacturing-quality issues so the first thing we checked was the temperature inside the oven. Instead of a stable regulated temperature, the oven temperature was rippling with a 5-degree C oscillation, as shown in the graph immediately below. We found that the thermocouple in the control system was not well thermally coupled to the oven temperature, so that was the first thing to remedy. A tightly-coupled temperature sensor (acheived by removing the thermocouple from its stainless-steel sheath and bonding it to the oven thermal plates with rigid thermal compound) and some improved settings in the PID controller solved this problem.
Vehicles
Application: Vehicles
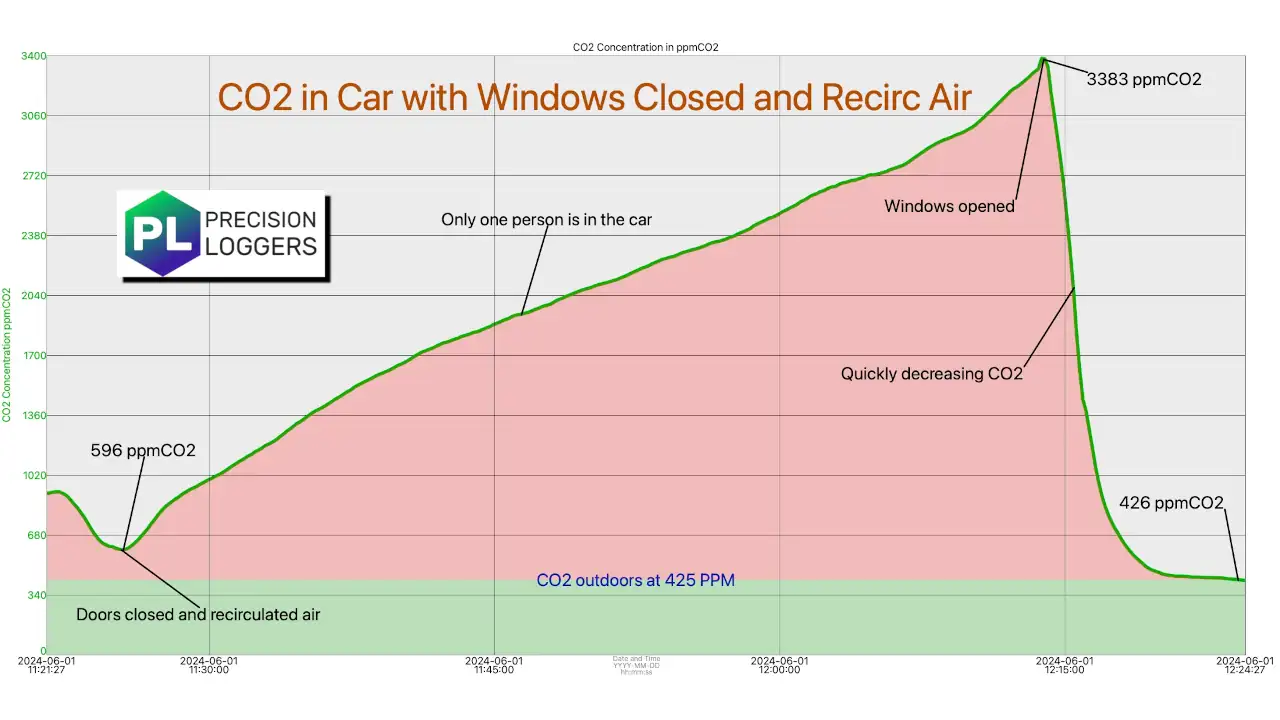
High CO2 concentration in a motor vehicle can cause dizziness, headache, sleepiness, cognitive dysfunction and slowed reaction time. All of these can adversely affect safety of the driver, passengers and other drivers on the road.
But just how high does the CO2 concentration get? With the windows closed, air conditioning switched on and the air supply set to recirculate (a common scenario when driving in Summer), let’s measure the CO2 concentration in a small generic economy car. We used a CO2 Logger with only the CO2 channel active. The visual alarm level was set to 425 ppm, the normal outdoor ambient CO2 concentration. Test duration was 45 minutes, with only one person in the car. CO2 level rose to 3383 ppm, which is much higher than the acceptable maximum of 1000 ppm.
Water Systems
Application: Water Systems
Case 1: Using Precision Loggers to troubleshoot and fix a small-town water system
The system pulls water from a well that goes dry in late summer, so it has a large water reservoir that is always kept full. It also usually pumps from the well to directly fill a 22-meter (70 ft) water tower that supplies the town. The symptom was that occasionally the tower tank goes empty for no known reason, and the problem was getting worse over time.