


HVAC
Study of a wood-heated building
Five data loggers were used to investigate the interactions of a wood stove with the building it is in:
3- Thermocouple, 1- CO2/RH/Temperature/Barometric and 1- Low Pressure logger.
Thermocouple temperatures were recorded in the firebox, the hot air output to the room, and exhaust temperature at the top of the chimney. CO2/RH/Temperature/Barometric pressure was measured around the wood stove. Building pressurization was measured in the same room as the wood stove relative to outdoor pressure. Graphs were visible in realtime as the tests proceeded, with all five loggers shown on the computer screen at all times.

Although most of the characteristics around the wood stove were quite normal, the extreme temperature oscillation of the firebox required correction. Investigation around the input air damper showed the bi-metal temperature control spring to have poor thermal coupling to the firebox. Shrouding and insulating the bi-metal spring to improve thermal coupling solved the problem, as shown below in a before & after graph of firebox temperature. The 'before' temperature line is taken directly from the graph above, and the 'after' graph line is from a subsequent test of the firebox using one Thermocouple logger only.

Vehicles
CO2 Accumulation in a Small Car
High CO2 concentration in a motor vehicle can cause dizziness, headache, sleepiness, cognitive dysfunction and slowed reaction time. All of these can adversely affect safety of the driver, passengers and other drivers on the road.
But just how high does the CO2 concentration get? With the windows closed, air conditioning switched on and the air supply set to recirculate (a common scenario when driving in Summer), let's measure the CO2 concentration in a small generic economy car. We used a CO2 Logger with only the CO2 channel active. The visual alarm level was set to 425 ppm, the normal outdoor ambient CO2 concentration. Test duration was 45 minutes, with only one person in the car. CO2 level rose to 3383 ppm, which is much higher than the acceptable maximum of 1000 ppm.

Agriculture
Ground Temperature, Surface to 30 cm Deep, Day and Night
What is the temperature underground where your crops grow? We measured the top 30 cm of ground temperatures in mid July day and night so that you could see the interesting characteristics and timing.
The surface temperature was by far the hottest and coldest, and the temperatures farther underground were much more stable. Notice the increasing phase shift with depth: the 30cm-deep waveform is almost 180 degrees (pi radians) out of phase with the surface waveform. The surface reached its highest temperature around 4:00 in the afternoon, while the temperature 30 cm down peaked at 2:30 in the morning, long after the sun had gone down.
For this graph we used five Precision thermocouple loggers with K thermocouples, and the graph was made using Precision Loggers Software running on an iMac M1 computer.

Water Systems
Case 1: Using Precision Loggers to troubleshoot and fix a small-town water system
The system pulls water from a well that goes dry in late summer, so it has a large water reservoir that is always kept full. It also usually pumps from the well to directly fill a 22-meter (70 ft) water tower that supplies the town. The symptom was that occasionally the tower tank goes empty for no known reason, and the problem was getting worse over time.
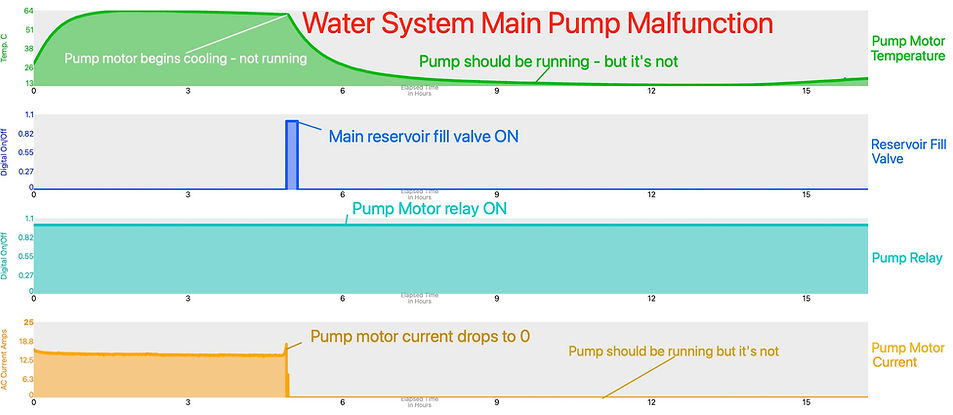
For this troubleshooting task we used five Precision Process Signal loggers. Three of them measured on-off relay contacts controlling motorized valves, one measured pump motor temperature with a non-contact 4-20 mA temperature sensor, and one measured pump motor AC current using an AC current clamp. The graphs were made using Precision Loggers Software running on an iMac M1 computer. One of the graph lines was hidden because it was not required.
From the first graph you can see that when the pump relay is ON, the pump motor sometimes runs and sometimes doesn't. We found that the pump motor failed intermittently. Replacing the motor solved the problem but revealed more trouble.
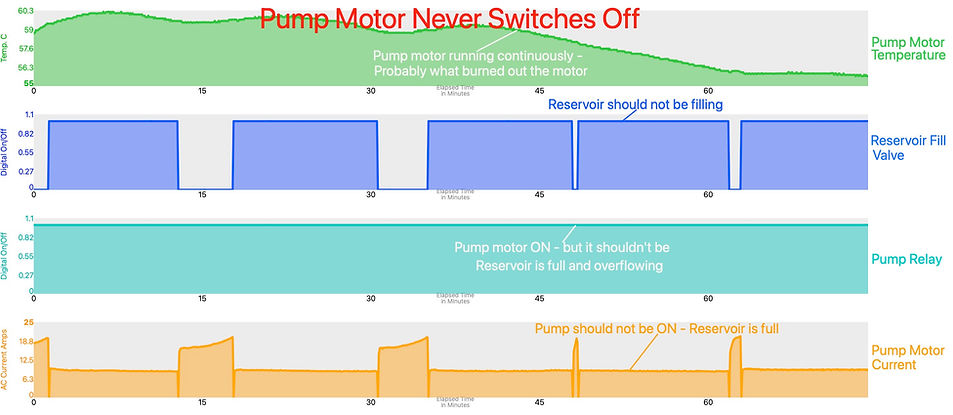
Now the pump motor runs continuously, overfilling the reservoir
The pump kept on trying to fill the reservoir at a time of year when the reservoir should have already been full. A short hike to the hidden reservoir showed that it was overflowing, and that the reservoir-full switch had failed in the open position. You can see this confirmed in the graph below, made after we had seen that the reservoir was completely full to overflowing.
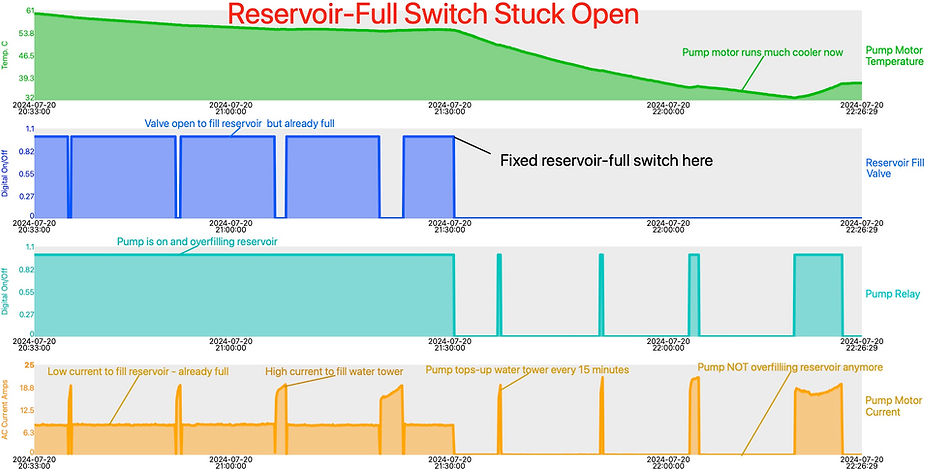
Replacing the reservoir-full switch solved the second problem
The graph below shows that when the reservoir-full switch was replaced, the new pump was not trying to overfill the reservoir any more. Instead, the pump motor was off most of the time, switching on every 15 minutes to fill the water tower only.
Precision Loggers showed exactly what the problems were so that we could proceed with confidence
Knowledge about the water system, gained by using Precision Loggers, helped to solve a long-term, gradually worsening water system problem that seemed unsolvable. The pump motor will now last much longer because it is running a 2 to 10% duty cycle, instead of 100%. The well water now lasts much longer into the dry season because it is not being pumped out needlessly. And the townspeople are happy to have a reliable water supply year-round.
Case 2: Water System Pipes Freezing in Winter
The small town's water system pipes would sometimes freeze during a very cold winter, resulting in severe damage to pipes, valves and pumps.
For this troubleshooting task we used four Precision Temperature loggers. The loggers were very easy to place in various locations because there are no wires to run or sensors to connect. The graphs were made using Precision Loggers Software running on an iMac M1 computer.
From the first graph you can see that even though the electric forced air heating is running (blue line) at night the motorized valves (yellow line) and water pipes near the floor (red line) would be vulnerable to freezing if the outdoor temperature (orange line) went much colder than -4.55 degrees C.

Solution: The air duct from the heater was re-routed to deliver its warm air to the areas vulnerable to freezing, raising the temperature of the floor & wall water pipes, and the motorized valves. Now the pipes won't freeze even if the outdoor temperature goes down to -25 degrees C, which is colder than it ever gets in this location. The graph shows us that the water pipes and motorized valves are 26 degrees warmer than the outdoor temperature.

Process
Using a thermocouple logger to troubleshoot and fix an infrared solder reflow oven
The infrared solder reflow oven was having manufacturing-quality issues so the first thing we checked was the temperature inside the oven. Instead of a stable regulated temperature, the oven temperature was rippling with a 5-degree C oscillation, as shown in the graph immediately below. We found that the thermocouple in the control system was not well thermally coupled to the oven temperature, so that was the first thing to remedy. A tightly-coupled temperature sensor (acheived by removing the thermocouple from its stainless-steel sheath and bonding it to the oven thermal plates with rigid thermal compound) and some improved settings in the PID controller solved this problem.

Now the oven temperature was stable
Overshoot and ripple were now minimal and oven temperature looked good at approximately 245 degrees C, but we hadn't run anything through the oven yet.

Using a Precision Thermocouple Logger, we sent a thermocouple sensor through the oven, attached to a PC board.
The graph below shows that the PC board was not reaching the required soldering temperature & time of 230 degrees C for at least 90 seconds. The conveyor belt was moving the product through too quickly for it to reach the target.

Slowing down the conveyor belt allowed the product to reach target temperature and time
The slower conveyor belt didn't adversely affect product throughput at all, as the PC boards were just placed closer together on the conveyor belt. Soldering quality improved drastically, resulting in greatly improved productivity.

The Precision Thermocouple Logger showed exactly what the problem was so that we could proceed with confidence
Knowledge about the infrared solder-reflow oven gained by using a Precision Logger helped to solve a long-term problem that seemed unsolvable. The infrared reflow oven now functions properly with improved product quality.
Aerospace
Study of aircraft cabin pressurization
using a barometric pressure logger
With the recent occurrence of a door plug blowout on an aircraft in Alaska, we thought it would be interesting to measure cabin pressurization during a flight. To verify that the aircraft cabin pressurization system was working properly, a Precision Barometric Pressure logger was used.
The graph shows a 3 hour flight, from sea level to sea level. Just before takeoff the cabin is slightly pressurized, about 0.1 PSI above ambient, When the aircraft takes off, cabin pressure is gradually reduced to about 10.9 PSI, about the same pressure as at 8000 feet altitude and was held fairly constant until descent. Pressure gradually rises back to 14.8 PSI during descent, and then drops to 14.7 PSI shortly after landing.
This is just about exactly what we would expect. The cabin pressure at max altitude is kept high enough for passenger comfort and health, and low enough so that the cabin is not stressed anywhere near or beyond its capability. Nowadays pressurized-cabin aircraft have two relief valves that open if the cabin pressure ever rises beyond acceptable limits, and a reverse relief valve that opens if the pressure inside the aircraft is ever negative relative to the outside pressure.


And just in case you'd like to see the graph in milliBar units:
